
Capture a useful profiling interval
Record the time, number of players and action: for example, teleporting to new chunks or starting one farm. Check /spark tps, then start a two-minute profile. If the background recording is already managed by Paper/spark, first open it via /spark profiler open or agree to stop: do not cancel someone else's diagnostics.
Reproduce the problem once with a known sequence of actions. When profiling finishes, save the link and a short note. For rare spikes, follow spark’s lag-spike guide so the relevant event is not averaged together with a minute of idle time.
/spark profiler start --timeout 120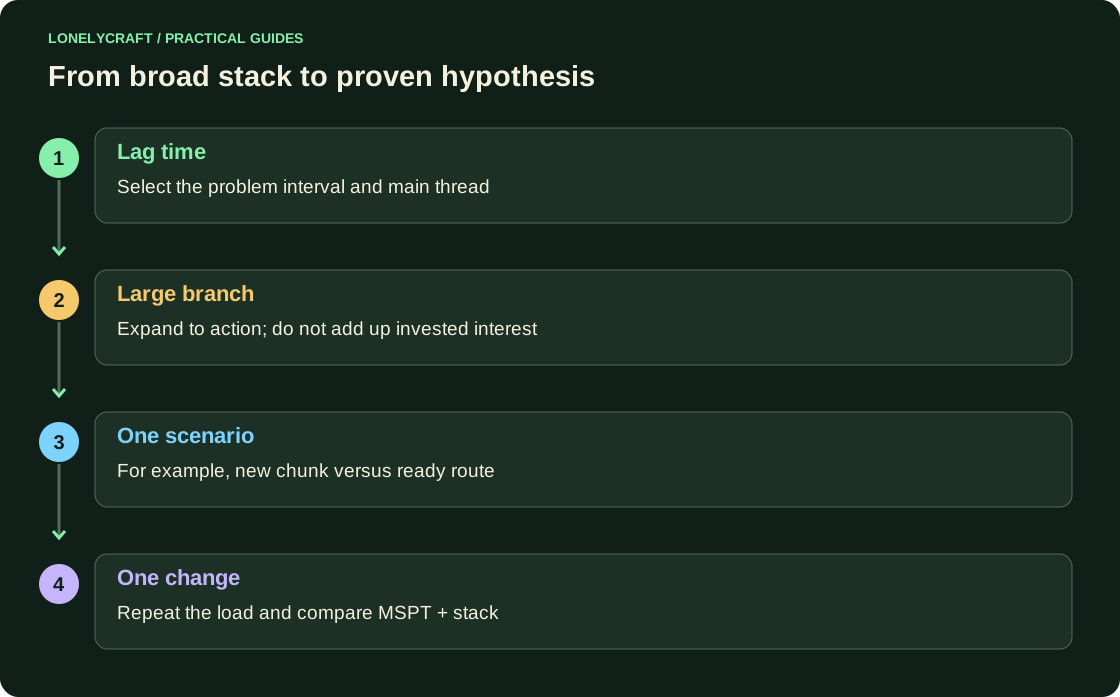
Choose the thread and time range
In the viewer, start with the main server thread and the interval where the lag actually occurred. Then open large branches to a specific action. The CPU costs of auxiliary threads are also important, but they are not equal to the main tick time.
Nested tree percentages include the work of child calls. If the parent has 60% and the child method has 40%, they cannot be stacked as independent 100%. A large Minecraft branch under a plugin could mean that the plugin is calling an expensive API multiple times, not that the entire game code is broken.
Turn the stack into one hypothesis
Chunk generation during exploration suggests comparing an existing area with a newly generated one. Frequent plugin tasks suggest checking their frequency and workload. For entities and block entities, identify a specific area and activity instead of deleting every mob on the server.
Write down the hypothesis in a testable form: “when entering new chunks, this branch occupies the main problem interval; on a preloaded route, the delay disappears.” This is stronger than the phrase “plugin takes up 20%, remove.” Don't take the library's name on the stack as evidence of its guilt.
Compare after one change
Repeat the same route, duration and approximately the same online. Compare MSPT and a specific branch, not just the relative percentage: the share may increase simply because other work has decreased.
For the developer, please attach both links, exact core/plugin versions, action and expected result. Check the composition of the report before sending it publicly; the profile can contain information about the environment. Success is the disappearance of the initial inhibition without breaking the game function.
What does a server tick measure and where is its budget? TPS and MSPT.
Stop the found source specifically, preserving the evidence. Working with overloaded mechanics.